



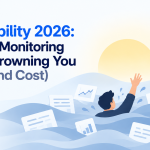


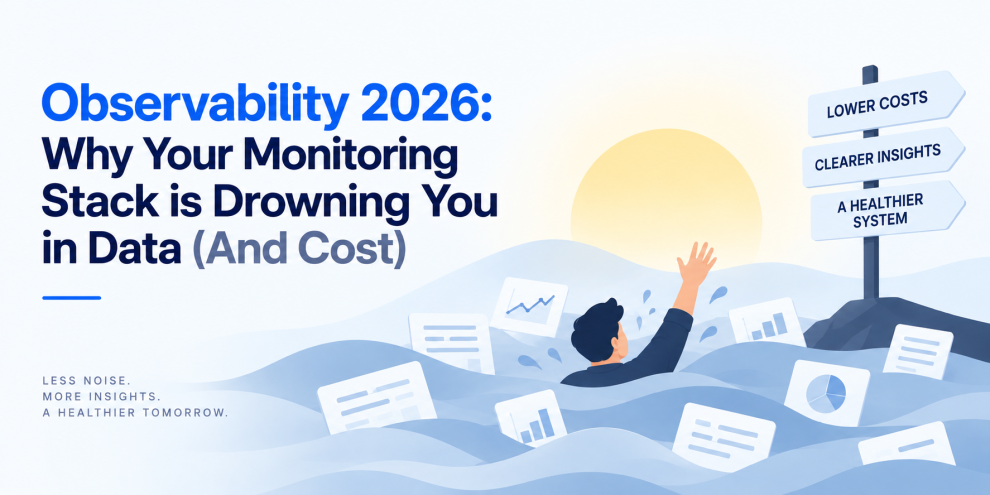

Modern software systems generate an enormous amount of telemetry. Every API request can produce traces, logs, metrics, events, security signals, database queries, container statistics, infrastructure metrics, and application diagnostics. Add microservices, Kubernetes, cloud platforms, AI agents, edge workloads, and distributed databases, and observability can quickly become one of the largest data pipelines in an engineering organization. The problem is no longer simply getting enough telemetry. It is getting the right telemetry without paying to store, process, index, and query information that nobody will ever use.
Many organizations respond to production incidents by increasing logging, enabling more tracing, retaining telemetry for longer, and collecting data from additional systems. That can improve visibility in the short term, but it also creates a cycle where more data produces higher infrastructure costs, greater query complexity, and more operational noise. In 2026, observability needs to become more selective. The objective is not maximum telemetry. It is maximum operational value per unit of telemetry.
The Observability Data Explosion
A modern production environment can generate telemetry from dozens or thousands of services. A single customer request might cross an API gateway, authentication service, frontend backend, several microservices, a database, cache, message queue, external API, and background worker. Each component can generate its own signals. Metrics may be emitted every few seconds. Logs can be generated for individual application events. Distributed traces can contain dozens or hundreds of spans for a single request. Security systems may generate another stream of events.
At large scale, the volume grows rapidly. The problem becomes particularly visible when organizations instrument everything at high cardinality and retain everything at maximum resolution. Telemetry that was originally intended to improve reliability can become a substantial infrastructure workload of its own.
More Data Does Not Automatically Mean Better Observability
A common assumption is that if engineers collect more information, they will be able to diagnose incidents more effectively. In practice, excessive telemetry can make investigations harder. An engineer investigating a failed API request may encounter thousands of logs, hundreds of trace spans, multiple dashboards, several alerts, and large volumes of unrelated infrastructure events. The challenge becomes finding the signal inside the noise.
Good observability should answer operational questions quickly: What failed? Where did it fail? When did it fail? Which users or workloads were affected? What changed? How widespread is the problem? What action should the engineering team take? Telemetry that does not contribute to answering these questions should be evaluated carefully.
High Cardinality Is Quietly Expensive
Metrics are particularly vulnerable to cardinality problems. A metric with a small number of dimensions may be inexpensive to store and query. Add user IDs, request IDs, session IDs, URLs, tenant IDs, container IDs, model IDs, or other highly variable attributes, and the number of unique time series can increase dramatically.
High-cardinality telemetry can increase storage requirements, indexing overhead, query latency, and observability platform costs. This does not mean high-cardinality information is always useless. In some cases it is operationally valuable. The important question is whether that information belongs in a metric. A useful pattern is to keep aggregated information in metrics and move detailed context into traces or logs where appropriate.
Distributed Tracing Can Become a Cost Multiplier
Tracing is one of the most valuable observability capabilities for distributed systems, but tracing every request at full fidelity can become expensive. Consider an application processing millions of requests. If each request creates dozens of spans and each span contains numerous attributes and events, the telemetry volume can quickly become substantial.
The answer is not to abandon tracing. Sampling is the more practical approach. Successful, routine requests can often be sampled at lower rates while errors, latency outliers, security events, and unusual workflows receive greater coverage. Tail-based sampling can be particularly useful because it allows telemetry systems to make sampling decisions after seeing more of the trace. A slow or failed request can therefore receive different treatment from a normal successful request.
Logs Are Often the Biggest Source of Noise
Logs are easy to add and difficult to remove. Developers frequently add debug statements during troubleshooting and forget that those statements may continue generating data in production. Applications can also produce repetitive informational logs that provide little value after deployment.
The result is a large volume of telemetry that consumes storage without improving incident response. Production logging should therefore be intentional. Teams should define appropriate log levels, structured fields, retention periods, redaction policies, and sampling strategies. Repetitive events should not necessarily be retained at the same level of detail as security incidents or application failures.
AI Is Making Observability Even More Complicated
AI applications introduce another layer of telemetry. An AI request can involve prompt construction, model inference, retrieval, vector database queries, tool calls, external APIs, validation, retries, guardrails, and response generation. An agent may perform several of these operations during a single user interaction.
If every prompt, model response, tool payload, retrieval result, and intermediate event is stored in full, telemetry volume can increase rapidly. There is also a security problem. AI telemetry may contain personal information, proprietary documents, customer conversations, internal instructions, authentication material, or other sensitive data. AI observability therefore requires both cost controls and data-governance controls.
Stop Storing Everything at the Same Retention Period
Not every telemetry signal needs to live for the same amount of time. Operational metrics may be useful for long-term capacity and reliability analysis. Detailed debug logs may have value for a much shorter period. Security events may require longer retention because of investigation or compliance requirements. High-fidelity traces may only need to be retained for a limited period unless associated with an incident.
A tiered retention strategy can significantly reduce unnecessary storage costs. Organizations can maintain high-resolution telemetry for a short period, aggregated data for longer periods, and archive selected security or compliance records according to their requirements. Retention should be based on operational value and regulatory obligations rather than simply choosing the longest available storage period.
Sampling Should Be a Policy, Not a Panic Button
Many organizations only think about sampling after their observability bill becomes a problem. By then, telemetry architecture may already be deeply integrated into engineering workflows. Sampling should instead be designed as part of the observability strategy.
Teams can establish different sampling priorities for different workloads. Normal requests may receive baseline sampling. Failed requests can receive higher sampling. High-latency traces can receive priority. Security events can receive full or near-full coverage. New releases can temporarily receive increased observability during the deployment window.
This creates a more intelligent telemetry pipeline. The objective is not simply to collect less. It is to preserve the information most likely to explain important system behavior.
Observability Pipelines Need Processing Before Storage
Sending raw telemetry directly from every application into an observability platform is rarely the most efficient architecture at scale. A telemetry processing layer can filter, transform, enrich, sample, route, and redact data before it reaches long-term storage.
OpenTelemetry Collectors are one example of this architecture. They can provide a centralized processing layer between applications and observability backends. This allows platform engineering teams to establish common rules without requiring every development team to implement them independently.
For example, an organization could remove sensitive attributes, drop unnecessary debug events, apply sampling rules, route security telemetry to a separate destination, and retain high-value traces at greater fidelity.
The Backend Should Not Be the Only Observability Destination
Different telemetry types often serve different operational purposes. Metrics are useful for trends, capacity, service health, and alerting. Logs provide detailed event context. Traces explain distributed execution paths. Security events support threat detection and investigation. Product analytics can explain user behavior.
Trying to store every signal in one system can create unnecessary cost and operational complexity. A better approach is to define which system should own which type of information and how those systems should be correlated. Correlation IDs, trace IDs, service identifiers, deployment versions, and consistent timestamps can allow engineers to move between telemetry sources without forcing everything into the same database.
Observability Should Be Connected to Deployments
One of the most useful pieces of context during an incident is knowing what changed. A performance regression after a deployment is much easier to investigate when telemetry can be associated with the application version, infrastructure change, configuration revision, feature flag, model version, or database migration that preceded it.
Observability should therefore capture deployment metadata as part of the operational context. When an alert fires, engineers should be able to ask not only “what is failing?” but also “what changed immediately before this started?” This can significantly reduce investigation time.
AI Observability Needs Its Own Cost Controls
AI systems can create particularly expensive telemetry because model interactions contain large payloads and generate multiple downstream operations. Instead of automatically storing complete prompts and responses, teams can capture metadata such as model identifier, latency, token counts, request status, prompt version, retrieval count, tool names, error categories, and evaluation results.
Full content can be retained selectively when there is a legitimate operational requirement and appropriate access controls. This approach provides useful operational visibility without turning the observability platform into an uncontrolled repository of sensitive AI data.
Build an Observability Budget
Engineering teams commonly create budgets for cloud compute, databases, and API usage. Observability deserves the same treatment. An observability budget can track telemetry volume, storage consumption, ingestion rates, query costs, retention, high-cardinality metrics, trace sampling, and costs by team or service.
This changes the conversation from “Why is observability so expensive?” to “Which telemetry produces enough operational value to justify its cost?” Teams can then make informed tradeoffs. A heavily used service generating millions of low-value informational logs may require aggressive reduction, while a critical payment workflow may justify much more detailed tracing.
Measure Observability Value
Cost alone should not determine telemetry strategy. A reduction in observability spend that makes incidents significantly harder to diagnose can create a larger business cost. Teams should therefore evaluate observability using operational outcomes.
Useful measures include mean time to detection, mean time to resolution, percentage of incidents with sufficient diagnostic data, alert quality, telemetry ingestion cost per service, storage cost, query performance, and the percentage of collected telemetry that is actually used during investigations. The goal is to optimize the relationship between observability cost and operational confidence.
Observability for Kubernetes and Microservices
Kubernetes environments can generate enormous telemetry volumes because every application service is accompanied by infrastructure-level signals. Clusters may produce metrics from nodes, pods, containers, workloads, controllers, networking components, ingress systems, and storage.
When every available metric is enabled by default, organizations can quickly accumulate large quantities of information that has little value for application-level troubleshooting. Platform teams should define a core telemetry baseline and make additional instrumentation intentional. Not every Kubernetes object needs the same monitoring depth, and not every metric needs long-term retention.
Don’t Let Dashboards Become Data Warehouses
A common observability mistake is creating dashboards for everything. A dashboard should answer a question, not simply display data. Engineering teams should periodically review dashboards and remove views that are no longer used. Alerts should also have clear ownership and action criteria.
If an alert does not lead to an investigation or action, it should be reconsidered. This is particularly important as organizations adopt more automated infrastructure and AI-powered systems. More components create more potential signals, but not necessarily more useful operational information.
Observability Needs Governance
At enterprise scale, observability should be treated as a platform capability with defined standards. Organizations should establish conventions for telemetry naming, attributes, sensitive-data handling, retention, sampling, access control, ownership, and cost allocation.
Teams should also define who is allowed to access detailed traces, logs, and AI interaction data. Without governance, different teams may independently adopt different observability tools and retention policies, resulting in duplicated telemetry pipelines and fragmented operational data.
What Engineering Leaders Should Audit
Engineering and technology leaders should periodically ask: How much telemetry does each service generate? Which signals are actually used during incidents? Which metrics have excessive cardinality? Are all traces sampled intelligently? Are debug logs still running in production? Are AI prompts and responses being stored unnecessarily? How long is each telemetry type retained? Can sensitive attributes be filtered before storage? Can observability costs be attributed to teams and services? Can engineers correlate telemetry with deployments and infrastructure changes?
These questions help identify observability waste before it becomes an infrastructure problem.
Where Engineering Teams Fit
Modern observability requires more than selecting a monitoring platform. It involves instrumentation, backend architecture, cloud infrastructure, distributed systems, security, data governance, and cost management. Engineering organizations such as GeekyAnts, Thoughtworks, and other engineering teams work across these areas when building and operating modern cloud-native systems.
The objective is not to collect less telemetry simply because telemetry costs money. It is to design a system where every important signal has a purpose, an owner, an appropriate retention policy, and a measurable operational value.
The Future of Observability
Observability in 2026 is moving away from the idea that more telemetry automatically produces better reliability. Modern systems need intelligent telemetry pipelines that understand workload importance, incident context, security requirements, data sensitivity, and cost.
Sampling will become more adaptive. Telemetry processing will increasingly happen before data reaches storage. AI systems will require specialized observability controls. Cost attribution will become more important. Engineering teams will increasingly treat telemetry as a resource that needs to be optimized rather than an unlimited stream of data.
The best monitoring architecture will not be the one that collects everything. It will be the one that can answer the most important operational questions with the least unnecessary data.
In a world where every service, container, API, and AI agent can generate telemetry continuously, observability maturity means knowing what to keep, what to discard, what to protect, and what to investigate. That is how engineering teams turn observability from a growing cost center into a reliable operational capability.
FAQs
Why is observability becoming so expensive?
Large distributed systems generate huge volumes of logs, metrics, and traces. High-cardinality metrics, full-fidelity tracing, long retention periods, and excessive logging can significantly increase ingestion and storage costs.
How can companies reduce observability costs?
Organizations can reduce costs through intelligent sampling, shorter retention for low-value telemetry, log reduction, cardinality management, telemetry filtering, aggregation, and routing data to appropriate storage tiers.
What is high-cardinality telemetry?
High-cardinality telemetry contains attributes with many unique values, such as user IDs, request IDs, session IDs, or dynamically generated URLs. Excessive cardinality can increase metric storage and query costs.
Should companies sample distributed traces?
For many high-volume systems, yes. Sampling can reduce telemetry volume while preserving important traces. Error, high-latency, security, and unusual traces can receive higher sampling priority.
How does AI affect observability costs?
AI applications can generate additional telemetry from model calls, retrieval, tool execution, prompts, responses, and agent workflows. High-volume AI workloads can therefore increase both telemetry costs and data-governance requirements.
Should companies store every application log?
Not necessarily. Logs should have a defined operational purpose, appropriate severity levels, retention periods, and access controls. Repetitive low-value logs can often be reduced or sampled.
What role does OpenTelemetry play in observability?
OpenTelemetry provides a vendor-neutral framework for generating, collecting, processing, and exporting telemetry. Its Collector can also provide a centralized layer for filtering, transformation, sampling, and routing.
How should observability data be retained?
Retention should depend on the telemetry type, operational value, security requirements, and regulatory obligations. High-resolution telemetry can often have shorter retention while aggregated or compliance-related data may require longer retention.
How can teams measure observability effectiveness?
Useful measures include incident detection time, incident resolution time, diagnostic coverage, alert quality, telemetry cost, storage usage, query performance, and how frequently collected telemetry is actually used during investigations.
Is more observability always better?
No. Excessive telemetry can increase cost and operational noise without improving incident response. Effective observability focuses on collecting the information needed to understand important system behavior.
For more, visit our homepage!



Add Comment