



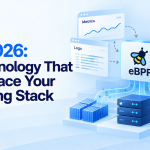



Modern DevOps teams have a monitoring problem. Applications are generating more logs, metrics, traces, Kubernetes events, network telemetry, and infrastructure data than ever before. Yet when something breaks, engineers still end up searching through dashboards and logs trying to reconstruct what happened.
eBPF is changing that model.
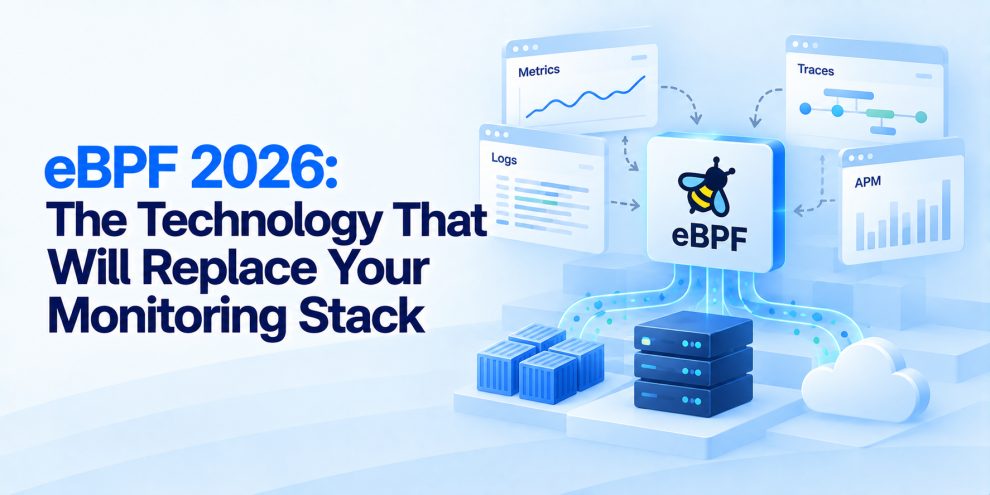
Instead of relying entirely on applications to expose telemetry, eBPF allows observability and security tools to inspect what is happening inside the Linux kernel and across workloads with far less application instrumentation. That makes it possible to observe network traffic, system calls, process activity, resource behavior, and application performance from a lower level of the stack.
But the claim that eBPF will simply “replace your monitoring stack” needs some qualification. eBPF is better understood as a new foundation for infrastructure observability that can reduce dependence on traditional agents and instrumentation while complementing metrics, logs, traces, and application-level monitoring.
For DevOps teams managing Kubernetes, microservices, cloud infrastructure, and increasingly complex production environments, that distinction matters.
Why Traditional Monitoring Is Becoming Difficult to Scale
Traditional monitoring depends heavily on application instrumentation and agents. Developers add libraries, exporters, logging frameworks, tracing SDKs, and monitoring agents to individual services. Infrastructure teams then collect that information and send it to observability platforms.
This approach works, but complexity grows quickly.
A large Kubernetes environment may contain hundreds of services written in different languages, running across different runtimes and infrastructure layers. Each service may produce telemetry differently. Instrumentation has to be maintained as applications change.
There is also a visibility gap.
Application telemetry can explain what a service reports about itself. It may not fully explain what the operating system, network, container runtime, or other processes are doing underneath it.
eBPF approaches observability from a different direction.
What Makes eBPF Different?
eBPF allows programs to run in the Linux kernel in a controlled way without modifying the kernel itself. This capability has enabled a growing ecosystem of networking, security, performance, and observability tools.
For DevOps teams, the important advantage is visibility closer to where system activity actually occurs.
An eBPF-based tool can observe events such as process execution, network connections, system calls, TCP behavior, container activity, and other kernel-level signals.
This means teams can obtain useful telemetry without requiring every application to be instrumented manually.
The result is a more infrastructure-centric approach to observability.
Kubernetes Is Where eBPF Gets Particularly Interesting
Kubernetes creates a difficult observability environment because workloads are dynamic.
Containers start and disappear. Pods move between nodes. Services communicate across clusters. Network policies change. Applications scale automatically.
Traditional monitoring systems need to keep up with this constantly changing topology.
eBPF can observe activity at the node and kernel level, making it possible to understand what workloads are actually doing even when application-level instrumentation is incomplete.
This can be especially valuable for network visibility.
Instead of relying entirely on application logs to determine why requests are failing, an eBPF-based system can provide visibility into network connections, latency, traffic flows, dropped packets, and communication between workloads.
That gives DevOps teams another layer of evidence when diagnosing production problems.
eBPF Can Reduce Instrumentation Overhead
One of the strongest arguments for eBPF-based observability is that teams can gain useful infrastructure telemetry without modifying every application.
Consider a company operating hundreds of services.
Instrumenting every service consistently requires development effort, libraries, configuration, upgrades, and ongoing maintenance.
With eBPF, certain signals can be collected from outside the application itself.
This does not eliminate instrumentation completely. Application-level context is still essential for understanding business operations, request semantics, user journeys, and application-specific behavior.
But eBPF can reduce the amount of custom instrumentation required for infrastructure-level visibility.
From Monitoring to Continuous Profiling
eBPF is also changing how teams think about performance analysis.
Traditional profiling is often something engineers enable when a performance problem occurs.
Continuous profiling takes a different approach by collecting performance information over time.
Because eBPF operates close to the kernel, it can support low-level profiling and performance analysis with relatively low overhead when implemented correctly.
This allows engineering teams to investigate CPU consumption, scheduling behavior, application performance, and resource contention without waiting for a major incident to reproduce the problem.
For DevOps teams, this moves performance analysis closer to normal observability rather than treating it as an emergency debugging activity.
Network Observability Is Becoming More Powerful
Microservices create enormous amounts of network communication.
A single request might travel through an API gateway, frontend service, authentication service, backend service, cache, database, message broker, and third-party API.
When latency increases, identifying the actual source of the problem can be difficult.
eBPF-based network observability can help teams understand communication patterns between workloads without requiring every service to expose detailed network telemetry.
This can reveal unexpected traffic, connection failures, latency patterns, service dependencies, and network bottlenecks.
For Kubernetes environments, that visibility can become particularly valuable as service-to-service communication grows.
eBPF and Security Are Converging With Observability
One of the most interesting developments is the convergence of observability and security.
The same low-level visibility that helps engineers understand system behavior can help security teams detect suspicious activity.
For example, unexpected process execution, unusual network connections, privilege changes, or access to sensitive resources can provide useful security signals.
This creates an opportunity for DevOps and security teams to work from shared infrastructure telemetry.
Instead of operating completely separate monitoring and security agents, organizations can increasingly use common kernel-level signals for multiple purposes.
The result can be fewer duplicated data-collection mechanisms and a more consistent view of infrastructure behavior.
Does eBPF Actually Replace Monitoring?
Not completely.
This is where the “replace your monitoring stack” claim needs context.
eBPF is extremely powerful for infrastructure, network, runtime, and security visibility. But it cannot automatically understand every business-level event.
If an organization needs to know whether a customer completed checkout, whether a payment workflow succeeded, or whether an AI response was grounded in approved documents, application-level instrumentation is still necessary.
The strongest architecture is therefore layered.
eBPF can provide deep infrastructure and runtime visibility. OpenTelemetry can provide application and distributed tracing. Logs can provide detailed event context. Metrics can support aggregation and alerting. Business telemetry can explain outcomes.
The opportunity is not to eliminate every existing monitoring technology. It is to reduce unnecessary instrumentation and create stronger correlation between infrastructure and application behavior.
eBPF Changes the Observability Architecture
A modern DevOps observability architecture can increasingly be organized around several complementary layers.
Kernel and infrastructure layer: eBPF captures process, network, system, and runtime signals.
Application layer: OpenTelemetry and application instrumentation provide request, trace, and business context.
Collection layer: Telemetry pipelines filter, enrich, sample, and route data.
Observability layer: Metrics, logs, traces, profiles, and network data are correlated in monitoring platforms.
This architecture is more flexible than relying on a single monitoring mechanism.
The important change is that observability no longer has to begin inside the application.
The Cost Advantage Matters
Observability costs are becoming a serious concern for DevOps organizations.
High-cardinality metrics, verbose logs, long trace retention, and duplicated telemetry can create substantial infrastructure and platform costs.
eBPF can help reduce some of this overhead by collecting signals closer to the source and allowing teams to decide which data actually needs to leave the host.
That does not automatically make eBPF observability cheap. Kernel-level telemetry can also generate significant data volumes if configured poorly.
The benefit comes from better control over what is collected, processed, retained, and exported.
Observability optimization should therefore be treated as an architecture problem rather than simply a storage problem.
eBPF Requires a Different Operational Skill Set
Adopting eBPF is not as simple as installing another monitoring agent.
Teams need to understand Linux internals, kernel behavior, networking, Kubernetes, workload identity, performance overhead, security boundaries, and telemetry pipelines.
Platform engineering teams also need to decide where eBPF should run, what data should be collected, how telemetry should be processed, and how it should integrate with existing observability systems.
The technology can simplify some forms of instrumentation while making infrastructure engineering more important.
What DevOps Teams Should Start With
Organizations do not need to replace their entire monitoring architecture to experiment with eBPF.
A practical starting point is infrastructure visibility.
Use eBPF to understand network communication, process behavior, Kubernetes workloads, and performance characteristics. Compare that data with existing application metrics, logs, and traces.
Then identify where eBPF provides information that existing tools cannot easily provide.
This approach makes adoption measurable rather than ideological.
The goal should be to answer a simple question:
Which observability problems are currently expensive or difficult to solve, and can eBPF provide a better signal?
Where Engineering Partners Fit
Adopting eBPF across production environments requires more than deploying a kernel-level observability tool. Teams need to integrate infrastructure telemetry with Kubernetes operations, application monitoring, security controls, and existing DevOps workflows. Engineering organizations such as GeekyAnts support this broader modernization by combining cloud infrastructure, backend engineering, observability, and DevOps expertise.
The objective is not to replace every existing monitoring technology. It is to build an observability architecture where engineers can move from application symptoms to infrastructure evidence without maintaining unnecessary layers of telemetry.
What DevOps Leaders Should Audit
Before introducing eBPF into a production environment, teams should ask:
Which monitoring signals currently require application instrumentation?
Where are observability costs growing fastest?
Can infrastructure and application telemetry be correlated?
Do teams have sufficient Kubernetes network visibility?
Are security and observability collecting duplicate signals?
Which workloads need continuous profiling?
How much telemetry is actually retained?
Can eBPF data be filtered and sampled before export?
Does the organization have the Linux and Kubernetes expertise required to operate it?
Most importantly, can engineers use the additional visibility to reduce mean time to detection and resolution?
If the answer is no, adding another telemetry source will simply create another dashboard.
The Future of DevOps Monitoring
The monitoring stack of 2026 is unlikely to disappear overnight.
Instead, it is becoming more layered.
eBPF is pushing observability closer to the operating system. OpenTelemetry is standardizing application telemetry. Continuous profiling is making performance data more persistent. Kubernetes is becoming increasingly observable through infrastructure-level signals. Security and observability are beginning to share more of the same telemetry.
That combination changes the role of monitoring.
The goal is no longer to collect everything.
It is to collect the right signals from the right layer and connect them into a useful explanation of what happened.
eBPF will not eliminate the need for logs, metrics, traces, or application instrumentation. But it can fundamentally change how DevOps teams see production systems.
The real promise of eBPF is not that it replaces your monitoring stack.
It is that it can make the stack smarter, deeper, and less dependent on application-level instrumentation.
For more, visit our homepage!



Add Comment