


When you first start with Kubernetes, it’s easy to get overwhelmed. You've got your applications running in containers, but how do you know if they're actually healthy? Effective monitoring isn't about just checking if a pod is "running." It’s about building a complete picture of your system's behavior.
This is where the Three Pillars of Observability—Metrics, Logs, and Traces—come into play. For a startup, getting this right from the beginning is the difference between flying blind and having a full control tower for your operations.
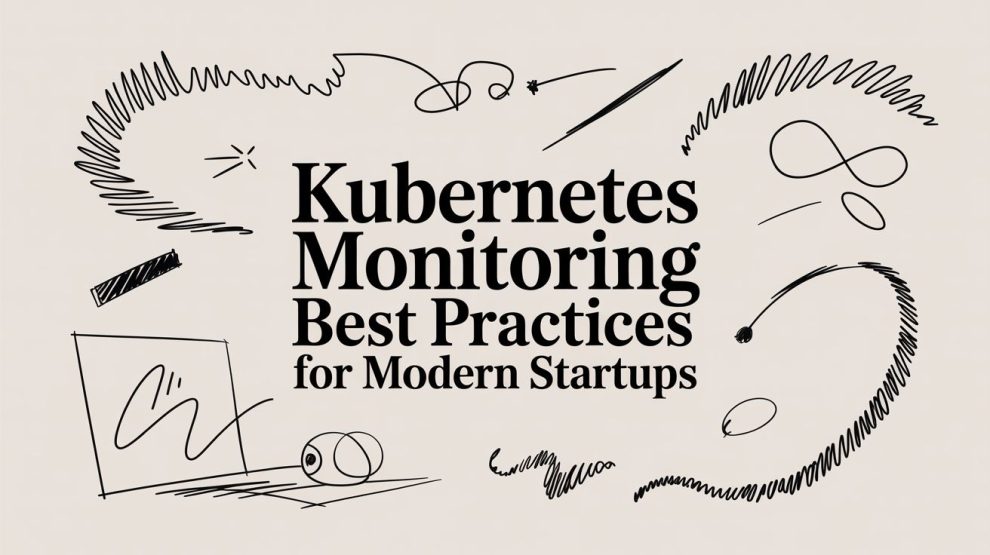
Building a Foundation for Kubernetes Monitoring

Before you can tackle advanced strategies, you need a solid base. Think of it like setting up the surveillance and logistics systems for a massive, automated warehouse. You wouldn't just install a single camera at the front door; you’d want sensors, inventory trackers, and package scanners all working together.
Getting these fundamentals in place is your first, most critical step toward building a monitoring system you can actually trust.
Understanding the Three Pillars of Observability
True visibility into your cluster depends on collecting and connecting three different kinds of data. When you bring them together, you get a powerful, multi-dimensional view of what's happening inside your system.
Metrics: These are your numbers—the quantifiable data points you collect over time. In our warehouse analogy, this would be the temperature, conveyor belt speed, or the number of packages processed per hour. For Kubernetes, this means things like CPU utilization, memory consumption, and API server latency. They tell you what is happening.
Logs: These are the detailed, timestamped event records. If a robotic arm in the warehouse suddenly stops, its log is the diagnostic report that says "Error: Grip sensor failed." In your cluster, logs capture everything from application errors to container startup sequences, giving you the raw context behind an event. They tell you why something happened.
Traces: A trace shows you the entire journey of a single request as it moves through your distributed services. Imagine tracking one specific package from the moment a customer clicks "buy" all the way to the delivery truck. A trace does this for your code, highlighting every service it touches and showing exactly how long each step took. They tell you where a problem is.
A single pillar only gives you a fraction of the story. A spike in your metrics (the "what") is just noise until you find the corresponding error in your logs (the "why") and use a trace to pinpoint the bottleneck in a specific microservice (the "where").
To help you get started, here's a quick rundown of the essential practices.
Core Kubernetes Monitoring Best Practices at a Glance
This table summarizes the foundational steps every team should take to establish a reliable monitoring setup from day one.
| Best Practice | Why It Matters for Startups | Key Action |
|---|---|---|
| Integrate the Three Pillars | Provides a complete picture to solve problems faster and with less guesswork. | Choose a tool that can ingest and correlate metrics, logs, and traces together. |
| Monitor the Control Plane | The control plane is the brain of your cluster; if it fails, everything fails. | Track API server latency, etcd health, and scheduler/controller manager performance. |
| Track Node-Level Metrics | Node resource exhaustion is a common cause of pod evictions and instability. | Monitor CPU, memory, disk, and network I/O for every node in your cluster. |
| Collect Container Logs | Application-level errors are often invisible without direct log access. | Configure a logging agent (like Fluentd or Vector) to centralize container logs. |
Implementing these core practices moves you from a reactive "break-fix" cycle to a proactive state of operational awareness.
By integrating metrics, logs, and traces, you move from simply monitoring known failure states to achieving true observability—the ability to ask new questions and understand the 'unknown unknowns' in your complex system. This is non-negotiable for debugging modern microservices.
Ultimately, building this foundation is about creating a single source of truth for your system's health. It allows your teams to diagnose issues faster, optimize performance proactively, and ensure the reliability your customers expect. For an in-depth look at how containers function within this ecosystem, you can learn more about the role of containers in DevOps in our detailed guide.
Tracking the Right Metrics, Logs, and Traces
Alright, let's get practical. Knowing what to watch in a Kubernetes cluster is everything. The sheer amount of data a cluster spits out can be a firehose, and a common mistake is trying to drink from it all at once. You end up collecting everything and understanding nothing.
A much smarter way to approach this is by thinking in layers. Is the problem with the cluster hardware itself, a misbehaving pod, or a bug deep in your application code? By focusing on the right signals at each layer, you can stop guessing and start diagnosing.
Monitoring the Cluster Layer
First things first: you have to keep an eye on the cluster's foundation. This is the control plane—the very brain of your Kubernetes operation. If the control plane gets sick, everything else will follow. Monitoring this layer is all about making sure the orchestrator itself is healthy and running smoothly.
Here are the vital signs you absolutely must track at the cluster level:
- Node Health: Are your nodes actually ready to do work? You need to watch the number of nodes in
Ready,NotReady, orUnknownstates. A growing number ofNotReadynodes is a five-alarm fire, often pointing to hardware failures or network splits. - API Server Performance: The API server is the front door for every single action in the cluster. Keep a close eye on its request latency and any error rates (especially 5xx errors). A jump in latency will grind deployments and autoscaling to a halt, while a high error rate tells you the control plane is overwhelmed.
- etcd Database Health: This is the cluster's source of truth, storing all your configuration data in a key-value store. Monitoring for leader election changes and overall database size is critical. If you see frequent leader changes, you might have network instability. If the database size is ballooning, you could be headed for a storage crisis.
Think of these as the cluster's heartbeat and blood pressure. You wouldn't diagnose a patient's cough without checking their vitals first. The same logic applies here—ensure the control plane is stable before you go digging for problems anywhere else.
Keeping the control plane healthy is a cornerstone of solid Kubernetes monitoring. Problems here are often the first domino to fall, giving you a crucial window to act before a cascade of failures impacts your applications and, ultimately, your users.
Monitoring the Pod and Container Layer
Next up are pods, the basic building blocks where your actual application containers live and breathe. This is where you start to connect infrastructure health to application behavior. Since pods and containers can be ephemeral—spinning up and shutting down constantly—catching their key signals is non-negotiable for troubleshooting.
At the pod level, you should be laser-focused on these metrics:
- Pod Restarts: A pod that's constantly restarting is screaming for help. This is often the symptom of a
CrashLoopBackOff, meaning your application is crashing, or it's repeatedly failing its health checks. - Resource Utilization: Always monitor CPU and memory usage against the requests and limits you've defined. A pod that keeps hitting its memory limit will get killed by Kubernetes (
OOMKilled), while one that maxes out its CPU will be throttled, leading to frustrating performance slowdowns. - Pod Evictions: If a node runs out of resources, Kubernetes will start evicting pods to save itself. If you see a high rate of pod evictions, it’s a strong signal that your nodes are too small for the workload you're throwing at them.
These signals provide a direct window into how your applications are performing within their assigned resources. They are the bridge between the infrastructure's health and the application's stability. For a more detailed look at how these pieces fit together, check out our guide on overall Kubernetes best practices.
Monitoring the Application Layer
Finally, we get to what matters most: the application itself. This is the layer your users interact with, which makes these signals the most critical ones for your business. Many engineers refer to these as the "Golden Signals" of service health.
- Latency: How long does it take for your app to answer a request? You should be tracking not just the average but also the 95th percentile (p95) latency. This tells you what the worst experiences are like for your users.
- Traffic: This is simply a measure of demand, usually in requests per second (RPS). An unexpected nosedive in traffic doesn't always mean your app is broken; it could be a problem with a client or an upstream service.
- Errors: What percentage of requests are failing? Tracking the HTTP 5xx error rate is fundamental. A rising error rate is a direct, unambiguous sign that something is wrong with your application.
- Saturation: How "full" is your service? This metric helps you understand how close you are to a bottleneck by measuring the most constrained resource, whether that's CPU, memory, or I/O. It's your early warning system, alerting you before performance tanks.
By pulling together metrics, logs, and traces from these three distinct layers—cluster, pod, and application—you build a complete picture. This is what allows you to move from frantic guessing to fast, precise debugging when things go wrong.
Standardizing Your Toolkit with OpenTelemetry
If you’ve been around engineering long enough, you’ve seen it happen: a startup’s monitoring stack becomes a messy patchwork of tools. You've got one vendor for metrics, another for traces, and maybe a third for logs. This isn't just cluttered; it's a real drag on your team. You end up with data silos, vendor lock-in, and a mountain of technical debt that slows you down right when you need to be speeding up.
The best practice to get ahead of this chaos is to standardize your instrumentation from the get-go. This is exactly what OpenTelemetry (OTel) was built for. Think of it less as a tool and more as a universal language for your observability data. It ensures that no matter which backend you use today or switch to tomorrow, your data stays consistent and portable.
Backed by the Cloud Native Computing Foundation (CNCF), OTel provides a single, open-source framework for collecting all your telemetry—metrics, logs, and traces. Instead of instrumenting your code over and over for different tools, you do it just once with OTel.
Why OpenTelemetry Is the New Standard
The industry has thrown its weight behind OpenTelemetry, and for good reason. The 2025 CNCF Annual Survey found that 78% of organizations running Kubernetes in production now use OpenTelemetry for monitoring. That’s a huge jump from just 52% the year before. For any startup trying to compete, this isn't a trend you can afford to ignore.
This isn't just hype. It solves a very real, very expensive problem: vendor lock-in. Adopting OTel means you're no longer tied to a specific vendor's proprietary agent or data format. It gives you the freedom to choose the best observability platform for your needs—whether that’s Prometheus, Jaeger, Datadog, or something else entirely—without rewriting all your instrumentation. This flexibility is a strategic advantage. You can find a great analysis of this shift in this deep dive on Kubernetes monitoring trends.
If your current vendor jacks up their prices or their product stagnates, you can simply point your data to a new destination. That's it. Your instrumentation code doesn't change.
This diagram shows the different layers of a Kubernetes environment you need to watch.

OpenTelemetry is designed to pull data from every single one of these layers—from the cluster and nodes down to individual pods and the application code itself—and merge it all into one unified stream.
Practical Implementation Strategies
So, how do you actually use OTel in Kubernetes? It’s surprisingly straightforward. The workhorse of your setup will be the OpenTelemetry Collector.
Think of the Collector as your central data router. It's a highly efficient agent you typically deploy as a DaemonSet, so it runs on every node in your cluster, ready to gather and forward telemetry.
Here's a breakdown of how it works:
- Receivers: These are the inputs. Collectors can be configured to pull metrics from Prometheus endpoints, accept traces in Jaeger or Zipkin formats, or ingest logs from sources like Fluentd. They're incredibly versatile.
- Processors: This is where the magic happens. Once data is ingested, processors can filter, sample, or enrich it. A common and incredibly useful step is to automatically add Kubernetes metadata—like pod names, namespaces, and labels—to every single metric, log, and trace. This provides invaluable context when you're debugging an issue.
- Exporters: These are the outputs. Exporters send your processed, context-rich data to one or more backends. You could, for example, send metrics to a long-term storage solution like Thanos while simultaneously sending traces to Jaeger for in-depth analysis.
But the real game-changer in the OpenTelemetry ecosystem is auto-instrumentation. For popular languages like Java, Python, and Node.js, you can get comprehensive tracing and metrics without touching your source code. By adding a simple annotation to your Kubernetes deployment manifest, the OTel operator can inject and configure the necessary instrumentation libraries into your pods as they start up.
This massively lowers the barrier to entry. Your developers get rich, detailed observability into their services without having to become instrumentation experts. By standardizing on OpenTelemetry, you're not just choosing a tool; you're building a flexible, future-proof monitoring foundation that can grow with you.
Implementing Intelligent Alerting with SLOs
Let's be honest: gathering terabytes of monitoring data is pointless if it doesn't lead to smarter decisions. We've all seen the most common anti-pattern in Kubernetes monitoring—alerting on absolutely everything. Every minor CPU spike, every temporary network hiccup. This approach doesn't make you safer; it just leads to "alert fatigue," where your on-call engineers are so buried in noise that they miss the one alert that actually matters.
The real goal is to move away from these noisy, system-level alerts and focus on what truly impacts your business and your users. This is where Service Level Objectives (SLOs) completely change the game. Instead of getting a page because a CPU hit 80%, you get a page because the user-facing error rate is about to breach its promise to your customers.
Defining User-Centric SLOs
Think of an SLO as a promise you make to your users. It needs to be framed around the things they actually care about.
Take an e-commerce site. What's a mission-critical part of the user experience? The checkout process. A strong, user-centric SLO wouldn't be about pod memory; it would be something like: 99.9% of checkout API calls will complete successfully within 500ms over a 30-day period.
This simple statement shifts the entire conversation away from abstract infrastructure metrics and connects it directly to business results. Building one is a straightforward process:
- Identify Critical User Journeys (CUJs): What are the non-negotiable paths users take in your app? Logging in, searching, adding to a cart, or completing a purchase are all great candidates.
- Choose Service Level Indicators (SLIs): These are the raw metrics you'll use to measure the journey. For our checkout example, the key SLIs are latency (how fast) and error rate (how often it fails).
- Set Your Objective: Define the target percentage and time window. Be realistic—100% reliability is an expensive myth that stifles innovation. A target like 99.9% gives you a clear goal while acknowledging that things happen.
The moment you define an SLO, you create its counterpart: an error budget. For a 99.9% availability SLO over a 30-day window, you have an error budget of about 43 minutes. This is the total amount of time your service can be "down" or "unhealthy" without breaking your promise. This budget is empowering. It lets your team decide how to "spend" it—on planned maintenance, a risky feature launch, or an unexpected outage.
An error budget is the currency of reliability. It transforms the tug-of-war between developers who want to move fast and operations teams who want stability into a data-driven negotiation. If you have budget left, you can ship new code. If you're running low, it's time to focus on reliability.
Leveraging AI for Proactive Alerting
The next frontier in Kubernetes alerting isn't just reacting faster; it's about not having to react at all. Modern monitoring tools are now integrating AI and machine learning to predict failures before they ever happen, a shift that's quickly becoming the new standard. To see how this fits into the bigger picture of operational excellence, our guide on Site Reliability Engineering best practices provides some excellent context.
AI-powered anomaly detection is expected to be table stakes by 2026, with some platforms already cutting alert noise by up to 70% through smart event correlation and predictive analytics. For engineering leaders, this means a chance to get ahead of problems. AI can now forecast resource saturation 24-48 hours in advance, which could help prevent the 40% of pod crashes and OOM kills that plague roughly 30% of production clusters. You can find more data on these Kubernetes monitoring trends from recent industry analysis.
Imagine this: instead of reacting to a OOMKilled event after the fact, your monitoring system sees a subtle rise in memory usage, correlates it with a slight increase in garbage collection latency, and predicts an impending crash. This early warning gives your team a chance to intervene before a single user is affected. By combining user-focused SLOs with predictive AI, you build an intelligent alerting strategy that truly respects your engineers' time and fiercely protects your customer experience.
Optimizing Kubernetes Cost and Security

Smart Kubernetes monitoring does more than just keep your services online. It's your best defense against two of the biggest operational headaches: runaway cloud bills and glaring security vulnerabilities. For any startup, running Kubernetes can feel like handing your cloud provider a blank check, and without a clear view into what's actually being used, costs can quickly spiral.
At the same time, the very nature of containers creates a fluid, ever-changing environment that can be tough to secure. Your monitoring data gives you the visibility to get a handle on both of these challenges. It turns observability into a practical tool for running Kubernetes not just effectively, but also efficiently and safely—a cornerstone of modern kubernetes monitoring best practices.
Mastering Cloud Cost Optimization
The first rule of taming your Kubernetes bill is simple: stop paying for resources you aren't using. Unused or oversized deployments are a common money pit, but they're entirely preventable once you start monitoring your actual consumption.
It all boils down to setting proper resource requests and limits for your workloads. Think of a request as the "guaranteed minimum" of CPU or memory a pod gets, while a limit is its "absolute maximum" ceiling. By analyzing historical usage data from your monitoring tools, you can confidently right-size these values instead of just over-provisioning "just in case."
Setting accurate resource requests and limits does two things. First, it stops greedy pods from starving their neighbors. Second, it gives the Kubernetes scheduler the information it needs to pack your nodes tightly and efficiently, which means you can run your entire cluster on fewer machines.
This data-driven approach lets you spot idle workloads that can be shut down or scale back deployments that are consistently over-provisioned. Another powerful move is to get serious about cost allocation using Kubernetes labels. By tagging all your resources by team, project, or feature, you can finally see who is spending what.
Tools like Kubecost or OpenCost can then slice and dice that data, turning your monolithic cloud bill into a granular report. This shines a light on where the money is going, creates accountability, and helps build a culture where everyone is mindful of costs.
Bolstering Security Through Monitoring
Your monitoring stack is also one of your most critical security tools. It's a real-time ledger of every single action happening in your cluster, making it an invaluable asset for spotting—and stopping—threats. A strong security posture is built on a foundation of total visibility.
The trick is to watch for specific patterns in your monitoring data that might signal malicious activity or a dangerous misconfiguration. This proactive stance is the only way to effectively protect your applications and customer data.
Here are a few key security practices to build into your monitoring workflow:
Watch the API Server: Keep a close eye on the Kubernetes API server logs. Are you seeing a sudden spike in
403 Forbiddenerrors? That could be an attacker trying to escalate their privileges. Unexpected requests from unknown IP addresses? That might be a sign of a breach in progress.Track Container Vulnerabilities: Integrate a security scanner into your pipeline so you're continuously tracking known vulnerabilities (CVEs) in your running container images. You can then set up alerts to fire the moment a new, high-severity vulnerability is detected in your production environment.
Audit Network Policies: Think of Kubernetes NetworkPolicies as your internal firewall, controlling which pods can talk to each other. Use your monitoring tools to visualize traffic flows and confirm that your policies are actually working, ensuring services can only communicate with the specific pods they're supposed to.
By making these checks part of your daily monitoring routine, you transform your observability platform into a vigilant security guard. This approach helps you catch threats early, enforce your security rules, and maintain compliance, keeping your cluster both lean and secure.
Common Questions About Kubernetes Monitoring
As you dive into Kubernetes, you're bound to run into some tough questions about keeping it healthy. Let's tackle a few of the most common ones that engineers and startup leaders face when setting up their monitoring strategy.
What Is the Difference Between Monitoring and Observability?
It’s easy to use these terms interchangeably, but they represent two different approaches. Monitoring is the classic approach: you collect specific, predefined metrics to watch for problems you already know can happen. Think of it as the check-engine light on your car—it tells you when a known issue, like high CPU usage, pops up.
Observability goes a step further. It’s about instrumenting your system so you can explore what’s happening and ask new questions on the fly, especially when "unknown unknowns" strike. In Kubernetes, this means having rich, connected data from metrics, logs, and traces (often unified with OpenTelemetry). It's the difference between seeing an alert and being able to dig in and understand a complex bug you've never encountered before.
Monitoring tells you that something is wrong. Observability gives you the tools to ask why something is wrong, even when you don't know what to look for. This is non-negotiable for troubleshooting modern, distributed systems.
What Is the Best Starter Stack for Kubernetes Monitoring?
For startups that need a robust foundation without the immediate cost of a commercial platform, the community has settled on a powerful open-source stack. This combo is a fantastic starting point for implementing kubernetes monitoring best practices and avoids vendor lock-in early on.
The battle-tested combination usually includes:
- Prometheus: The de facto standard for scraping and storing time-series metrics.
- Grafana: The perfect partner to Prometheus for visualizing data and building insightful dashboards.
- Jaeger: A great choice for distributed tracing, which helps you follow a single request across multiple microservices.
- EFK Stack (Elasticsearch, Fluentd, Kibana): A popular trio for aggregating, storing, and searching through all your container logs.
A pro tip? Start with these tools, but instrument your applications with OpenTelemetry from day one. It gives you a standardized way to generate telemetry, making it much easier to switch to a different backend or a commercial vendor down the road as your needs grow.
How Can I Effectively Monitor My Kubernetes Costs?
Getting a handle on Kubernetes costs is all about visibility. If you can't see what you're spending, you can't control it. The first step is purely operational: enforce resource requests and limits on every pod you deploy. This alone prevents runaway resource consumption and helps the scheduler pack pods more efficiently.
Next, get organized with Kubernetes labels. Tag every workload by team, project, or application—whatever makes sense for your business.
Once you have that in place, tools like Kubecost or the open-source OpenCost can connect to your cluster and your cloud provider's billing API. They use your labels to show you exactly which team or application is driving up the bill. Making this a regular review process is key to spotting over-provisioned clusters and killing zombie resources before they burn through your budget.
At DevOps Connect Hub, we provide the actionable guides and curated insights you need to build, scale, and manage your cloud-native infrastructure effectively. https://devopsconnecthub.com


Add Comment