




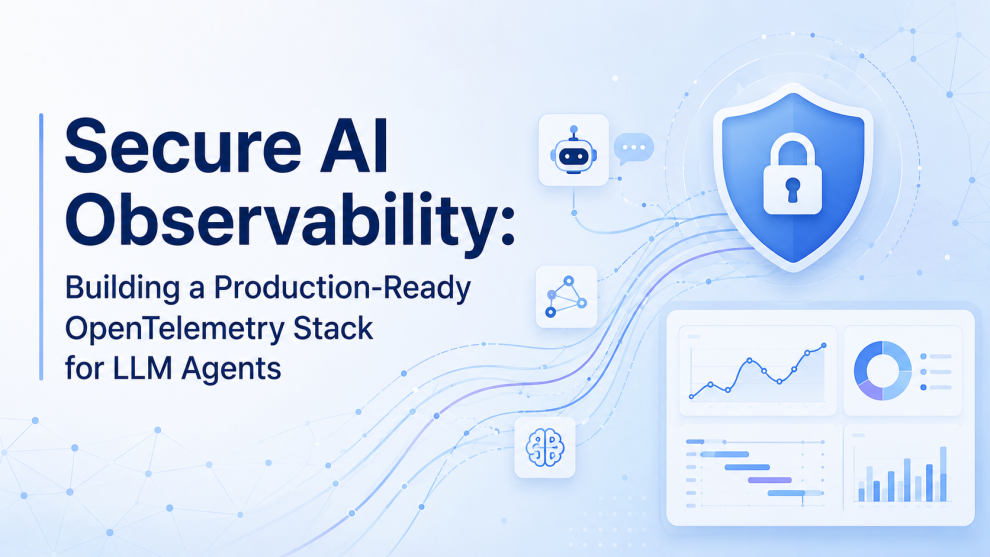

LLM agents are moving from prototypes into production workflows across customer experience, internal operations, software delivery, analytics, and digital products. That shift creates a new engineering challenge: traditional application monitoring is no longer enough to explain what an AI agent did, why it made a particular decision, which tools it called, what data influenced the response, or where a failure occurred.
For VP-level engineering and technology leaders, AI observability needs to become part of the production architecture rather than an afterthought. A production-ready observability stack should connect application telemetry, model interactions, retrieval activity, tool calls, infrastructure signals, security events, and quality outcomes while protecting sensitive information throughout the pipeline.
Why LLM Agents Require a Different Observability Model
A conventional application often follows a predictable request path: a user request reaches an API, the API calls a service, the service queries a database, and a response is returned. An agent can behave very differently. A single request might trigger an LLM inference, retrieval from a vector database, several tool calls, additional model calls, validation logic, external APIs, and another reasoning cycle before the final response is produced.
This creates a distributed execution graph rather than a simple request-response path. When an agent produces an incorrect result, engineering teams may need to determine which model invocation caused the issue, what instructions were supplied, which retrieved information influenced the response, which tools were called, whether an external API returned unexpected data, how many tokens were consumed, and whether sensitive information entered the telemetry pipeline. Without correlated telemetry, diagnosing these issues can require manually reconstructing events across multiple systems.
OpenTelemetry as the Foundation
OpenTelemetry provides a vendor-neutral foundation for collecting and exporting telemetry across applications and infrastructure. For AI applications, the value goes beyond basic tracing. Teams can use OpenTelemetry to create a consistent execution model across agent services, model calls, retrieval systems, APIs, and supporting infrastructure.
A typical flow can be represented as User Request → Agent Service → LLM → Retrieval/Tool Layer → External Systems → Response. Instrumentation can connect these operations into a trace, while metrics and logs provide additional operational context. AI-specific attributes can capture model identifiers, agent steps, retrieval operations, tool execution, latency, errors, and token consumption.
Designing the Trace Model for AI Agents
The first architectural decision is determining what should become a span. A useful AI observability model can include spans for incoming requests, agent execution, LLM inference, prompt construction, retrieval operations, embedding generation, vector database queries, tool invocation, external API calls, guardrails, validation, response generation, and human escalation.
The parent-child relationship between these spans allows engineers to move from a high-level request down to the specific model call or tool operation responsible for a problem. An agent trace might look like User Request → Agent Run → Retrieval → LLM Call → Tool Call → LLM Call → Validation → Final Response. This structure makes agent behavior far easier to investigate than isolated logs.
Do Not Treat Prompts and Responses Like Ordinary Logs
One of the biggest mistakes in AI observability is capturing everything without considering what the telemetry contains. Prompts and model responses can contain personally identifiable information, confidential records, proprietary content, authentication material, customer conversations, or regulated data.
A production architecture should distinguish between diagnostic metadata and sensitive payload content. Useful telemetry can include model identifier, request correlation ID, agent version, prompt template version, token counts, latency, retry count, tool name, tool duration, retrieval count, error category, response status, and guardrail outcomes. Raw content should only be retained when there is a clearly defined operational requirement and appropriate controls.
Redaction, filtering, sampling, encryption, retention policies, and role-based access should be considered before telemetry reaches the backend.
Build Security Into the Telemetry Pipeline
Observability becomes part of the security boundary when AI systems operate at scale. A secure architecture can place an OpenTelemetry Collector between instrumented applications and downstream observability platforms: AI Applications → OpenTelemetry SDKs → OpenTelemetry Collectors → Processing/Filtering → Observability Backend.
The Collector can provide centralized control for attribute filtering, sensitive-data removal, sampling, routing, batching, transformation, and export policies. This is particularly valuable for large organizations where different applications have different data-handling requirements. Instead of allowing every service to independently determine what telemetry leaves the environment, platform engineering teams can establish organization-wide policies.
Protecting Sensitive AI Telemetry
Security controls should operate across multiple layers. At the application layer, teams should minimize the information emitted into telemetry and avoid automatically recording credentials, authorization headers, complete database records, or sensitive tool payloads. At the Collector layer, filtering and transformation policies can remove or modify sensitive attributes. At the storage layer, access controls and encryption should protect retained telemetry. At the organizational level, retention policies should define who can inspect AI traces and for how long.
The guiding principle is straightforward: collect enough information to explain system behavior, but not more sensitive information than necessary.
Observability for Tool-Calling Agents
Tool use is one of the most important areas to monitor because agents increasingly interact with APIs and internal systems. Consider an agent that understands a request, retrieves information, calls an API, validates the result, calls another service, and generates a response. A failure could originate from the model, retrieval layer, API, authorization, application logic, or validation layer.
Each tool invocation should therefore have its own trace context. Telemetry can capture the tool identifier, version, execution status, duration, correlation ID, validation result, retry information, and error classification while excluding or transforming sensitive request and response payloads. This makes it easier to distinguish an agent reasoning problem from a downstream system failure.
Measuring More Than Latency
Traditional application monitoring focuses on latency, throughput, availability, and error rates. Those metrics remain important, but AI systems introduce additional dimensions. Engineering teams should monitor model metrics such as token consumption, model selection, inference latency, failure rates, and fallback frequency. Retrieval metrics can include retrieval latency, result counts, empty-result frequency, and retrieval failures. Agent metrics can include steps per task, tool-call frequency, task completion rate, escalation rate, and loop detection.
Quality and security metrics are equally important. Teams can track validation failures, groundedness indicators, evaluation scores, policy violations, sensitive-data detection events, unauthorized tool attempts, and anomalous agent behavior. Together, these signals provide a more realistic view of production AI performance.
Sampling Is Essential at Scale
Capturing every AI interaction at full fidelity can become expensive and operationally difficult, particularly when organizations process millions of interactions. Sampling allows teams to preserve observability while controlling telemetry volume.
Routine successful requests can be sampled at a lower rate, while failed requests, policy violations, high-latency operations, repeated tool failures, human escalations, and unusual agent behavior can receive deeper coverage. The objective is not simply to collect less data. It is to collect the right data for diagnosis, security, and operational decision-making.
Connect AI Telemetry With Existing Engineering Systems
AI observability should not become another isolated monitoring environment. The strongest architecture connects AI traces with existing application monitoring, infrastructure monitoring, logging, incident management, and security workflows.
An engineer should ideally be able to move from Customer Request → Agent Execution → Model Call → Retrieval → API Call → Infrastructure Event → Incident. This correlation can significantly reduce investigation time and help teams identify whether an incident originated in the AI layer or an underlying service.
For platform teams supporting multiple products, standardized telemetry conventions also make it easier to compare applications, create shared dashboards, and identify systemic issues.
Governance Matters as Much as Instrumentation
For large North American organizations, AI observability is closely connected to governance. Different teams may deploy different models, frameworks, vector stores, agent architectures, and observability platforms. Without common standards, telemetry becomes fragmented.
Platform engineering leaders should establish conventions covering required trace attributes, naming standards, sensitive-data handling, retention periods, sampling policies, access controls, environment separation, model and prompt versioning, incident escalation, and audit requirements. This turns observability from a developer-specific feature into a platform capability.
Version Everything That Can Change Agent Behavior
AI systems are unusually sensitive to configuration changes. A model upgrade, prompt modification, retrieval configuration change, tool update, or guardrail adjustment can change production behavior.
Observability should therefore capture version information wherever practical, including agent version + model version + prompt version + retrieval configuration + tool version. When a quality regression appears after a deployment, this metadata can help determine exactly what changed. Without it, teams may know that an agent became less reliable but struggle to identify the underlying cause.
Building a Production-Ready Reference Architecture
A scalable architecture can be organized into five layers: Instrumentation, where OpenTelemetry SDKs capture traces, metrics, and logs; Collection, where OpenTelemetry Collectors provide processing, filtering, sampling, batching, and routing; Security and Governance, where sensitive-data filtering, encryption, identity controls, retention, access management, and auditing are applied; Observability, where traces, metrics, logs, and AI evaluation data are stored; and Operations, where dashboards, alerts, incident workflows, and evaluations turn telemetry into engineering action.
This layered approach allows organizations to evolve individual components without redesigning their entire AI observability strategy.
What Engineering Leaders Should Audit Before Production
Before approving an LLM agent for production, technology leaders should ask: Does every major agent operation have trace context? Can engineers reconstruct a complete agent execution? Are model calls correlated with retrieval and tool calls? Can sensitive prompt and response data be filtered before export? Are telemetry retention periods defined? Can teams identify the model, prompt, agent, and tool versions involved in an incident? Are abnormal agent behaviors detectable? Are high-risk events prioritized for deeper observability? Can AI incidents connect to existing incident-management workflows? Are observability permissions aligned with the sensitivity of the underlying data?
These questions help identify gaps that may remain invisible during the prototype stage.
Where Engineering Partners Add Value
Moving AI agents into production requires more than selecting a model. Application architecture, APIs, data systems, security controls, observability, and operational workflows all need to work together. Teams such as GeekyAnts bring experience across AI engineering, application development, backend systems, and modern product architecture, which can help organizations approach production AI as a complete engineering challenge rather than an isolated model implementation.
The Next Stage of AI Observability
LLM observability is becoming less about watching individual model calls and more about understanding complete AI-driven systems. For large organizations, the production question is no longer simply, “Is the model responding?” It is what did the agent do, why did it do it, what systems did it touch, what data influenced the outcome, and can we demonstrate that the workflow operated within the controls we designed?
OpenTelemetry provides a strong foundation for answering those questions. Combined with careful instrumentation, secure telemetry processing, intelligent sampling, governance, version tracking, and integration with existing engineering operations, it can become a core part of the production architecture for AI agents. Organizations that approach AI observability as a platform capability rather than a debugging add-on will be better positioned to scale agentic systems while maintaining visibility, control, and operational confidence.
For more, visit our homepage!


Add Comment